Sceptical Science has a very nice graphic showing how a global temperature decline, or series thereof, is confected from the obvious long term trend.
Going Down the Up Escalator, Part 1
Right now we're in the midst of a period where most short-term effects are acting in the cooling direction, dampening global warming. Many climate "skeptics" are trying to capitalize on this dampening, trying to argue that this time global warming has stopped, even though it didn't stop after the global warming "pauses" in 1973 to 1980, 1980 to 1988, 1988 to 1995, 1995 to 2001, or 1998 to 2005 (Figure 1).
As Figure 1 shows, over the last 37 years one can identify overlapping short windows of time when climate "skeptics" could have argued (and often did, i.e. here and here and here) that global warming had stopped. And yet over the entire period question containing these six cooling trends, the underlying trend is one of rapid global warming (0.27°C per decade, according to the new Berkeley Earth Surface Temperature [BEST] dataset). And while the global warming trend spans many decades, the longest cooling trend over this period is 10 years, which proves that each was caused by short-term noise dampening the long-term trend.
…
Other Physical Evidence of Continued Warming
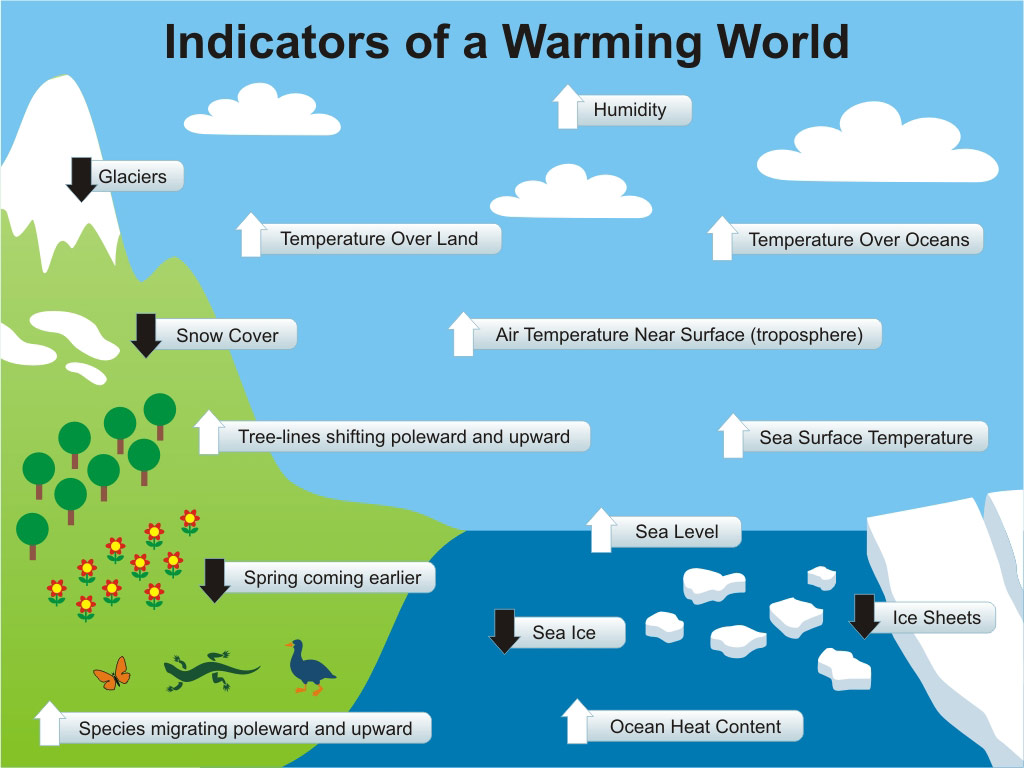
It's also important to point out that global temperature measurements aren't our only evidence of the long-term global warming trend. We've observed many physical indicators of global warming (Figure 2).

Figure 2: Physical Indicators of a Warming World
See the original post for a detailed account.
No comments:
Post a Comment